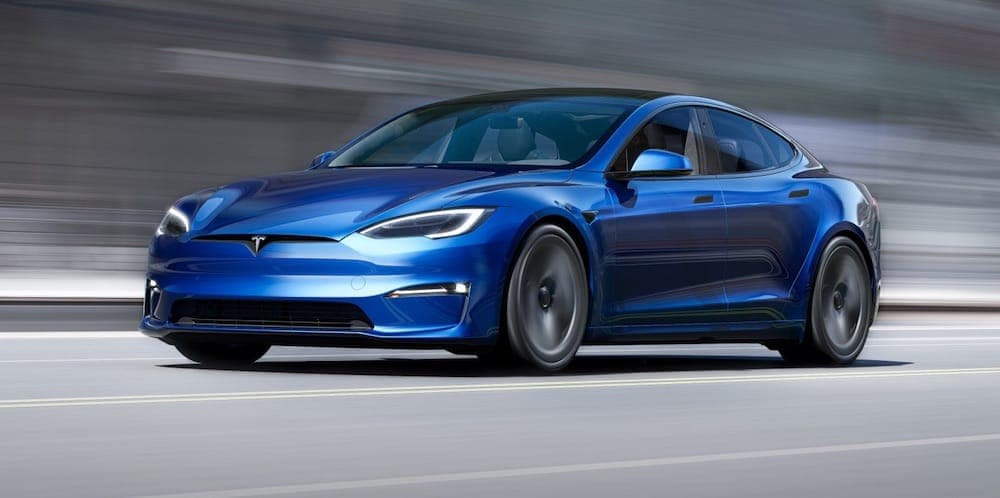
Tesla Model S
Contents
Tesla Model S FUTURE
- Body Type
- Seats
- Drive
- Sedan
- 5
- AWD
- 0-100 km/h
- Power
- Home charge
- 🔥 3.2 seconds
- 500 kW
- 16.5 kW
- Release Date
- Efficiency
- 2022Q4
- 146 Wh/km
Tesla Model S (2015-2021) USED
- Body Type
- Seats
- Drive
- Sedan
- 5
- RWD
- 0-100 km/h
- Power
- Home charge
- -
- -
- -
- Efficiency
- -
The Tesla Model S was sold in NZ from 2015 onwards. A large number of variations are on the secondhand market, starting from the 60 kWh battery models, right up to the 100 kWh performance models.
2017 was the peak year for Model S sales. Sub-models include the 60, 60D, 70, 70D, 75, 75D, 75R, 85, 85D, P85, 90, 90D, 100D, P100D.
Tesla Model S Plaid FUTURE
- Body Type
- Seats
- Drive
- Sedan
- 5
- AWD
- 0-100 km/h
- Power
- Home charge
- 🔥 2.1 seconds
- 760 kW
- 16.5 kW
- Release Date
- Efficiency
- 2022Q4
- 151 Wh/km
How many Model S's sold in NZ by Year and Month
Data shown for all Tesla Model S variations combined including both NZ New and Used import registrations.
How many Model S's are there in NZ?
There have been 468 Tesla Model S's registered in NZ to date. This is made up of 77.1% NZ New, and 22.9% Used Import.
How many of each submodel is there?
How many units of each major model variation (NZ new) have been registered to date.
Raw submodel data | Units |
---|---|
75D 193KW/EV/4WD/FD | 84 |
100D 193KW/EV/4WD/FD | 39 |
75 | 30 |
90D | 25 |
75D | 25 |
LONG RANGE 208KW/EV | 24 |
100D | 21 |
P100D | 19 |
<blank> | 16 |
PERFORMANCE 380KW/EV | 15 |
P100D 375KW/EV/4WD | 12 |
P90D | 6 |
60R | 5 |
P85D | 5 |
60D | 5 |
60 | 4 |
90 D | 4 |
85 | 3 |
LONG RANGE PLUS 208K | 3 |
75R | 2 |
70 | 2 |
STANDARD RANGE 208KW | 2 |
85D | 2 |
P85+ | 1 |
60 D | 1 |
LONG RANGE AWD 195KW | 1 |
75R 350KW/EV/FD | 1 |
85 D | 1 |
S85 | 1 |
70D/75D | 1 |
70D | 1 |
Data is from all vehicles entered in the NZ Motor Vehicle Register open data obtained from Waka Kotahi. It is not the size of the current fleet, as some vehicles may subsequently be cancelled or de-registered. Raw submodel names are inconsistent, so for the pie charts the data has been 'fixed' to show more meaningful submodel names.